
Hacker News is one of my favourite communities. According to Apple’s screen time, I spend an average of 30 min per day on this website.
For the past weeks, I have been looking around the concept of embeddings. Even though I’m fairly new to it, I wanted to build a side project involving them.
Here’s how I have extracted thousands of articles from Hacker News.
Disclaimer: I have no background either in data science or professional software engineering, so if I make a mistake, please report it kindly in the comments.
Table of contents
What is an embedding?
An embedding is the representation of a real-word object (an image, an article, a word) into a vector of dimension n. By representing it mathematically, we can compare, group and classify these objects easily.
Let’s say we have 7 posts from Hacker News, and we are computing their embeddings using a fake model:
- Banned C standard library functions in Git source code
- Modern C++ for C Programmers++
- Startups in 13 Sentences
- How to professionally say
- Cost of Health Care By Country, as Compared to Life Expectancy
- Stripe Is Now a $20B Company
- Snap commits $2B over 5 years for Google Cloud infrastructure
Each post can be mapped to a vector (x, y). For example,« Stripe is Now a $20B Company » equals to (-10.5, -1.5).

But what’s the point?
As we can see, related posts are next to each other. « Startups in 13 sentences » is closer to « How to professionally say » than to « Modern C++ for C Programmers ». Having related items grouped is very useful. We can do:
- Classification (To which group an item belongs?)
- Clustering (What are the main topics?)
- Recommendation (What are the most similar items of one)
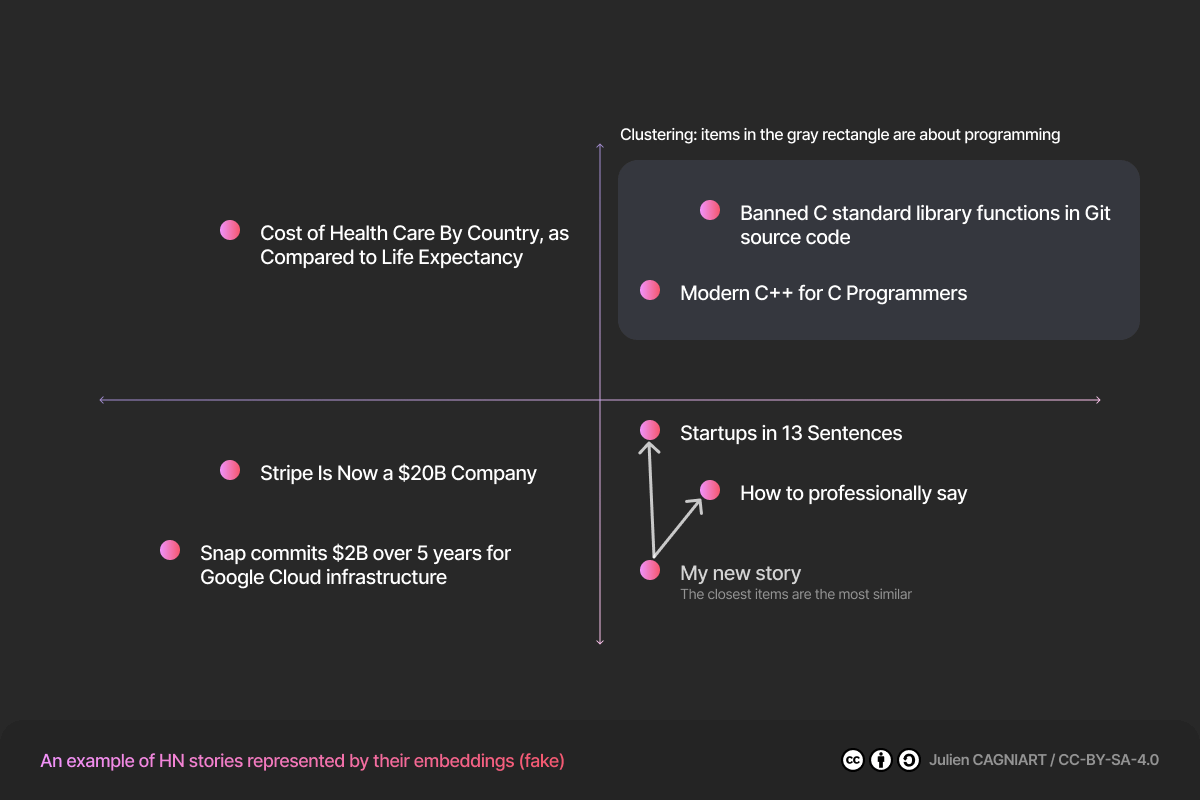
For instance, we can say that all vectors that are positive (in the top right end corner) are about programming. We have made a cluster of our embedding.
Furthermore, to get a recommendation system, we just have to get the closest item to « My new story ». In our example, the software could suggest the article « How to professionally say ».
Note: While all examples have featured a vector of dimension 2, real-world vectors are more likely to have a dimension larger than 128.
How do we compute them?
There are many models to do so:
You send a text, some black magic happens, and it gives you back a vector representing the text.
I have personally chosen OpenAI because I didn’t want the hassle of hosting the model by myself and OpenAI seemed to be cheaper than Cohere.
How have I extracted +100 000 embedding?
I know I have over-engineered my solution. I could have made it much simpler and faster. Nevertheless, I have learned a lot during my journey, and I’m a student, so it’s no time wasted.
How to get an article?
To start, we have to extract the text from the article. My first solution was to download the page, render it using a headless browser and extract the text. Yet, you still have many issues:
- How do you handle websites that prevent scraping? (CAPTCHAs)
- How do you extract text from raw HTML (there is no need to extract the navbar, any ads, etc.)
To tackle these concerns, I went to another path: Diffbot. It’s a service that provides many APIs, including article extracting. Thanks to their Student program, I was able to register without any costs.
Now that I know how to extract the articles, I just have to compute the embeddings and save them somewhere.
The whole architecture
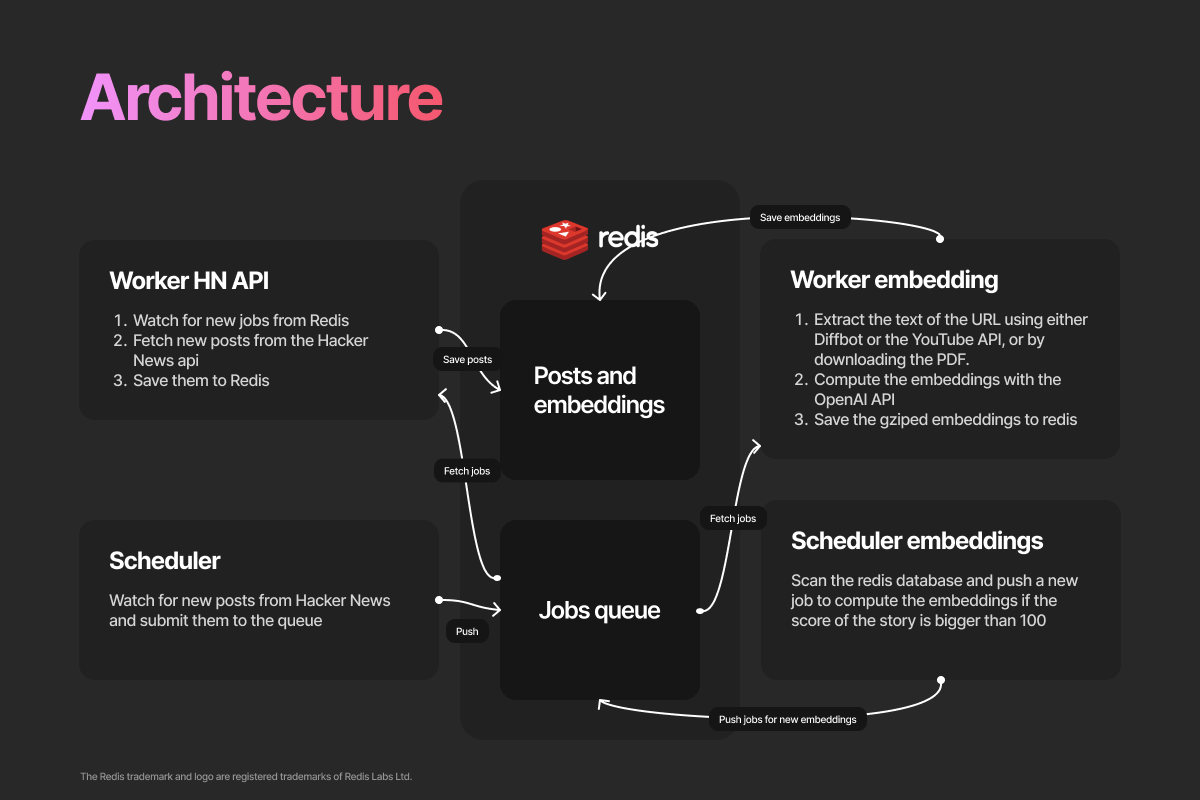
If you didn’t have a stroke, let me explain. I know all this schema could have been a simple Jupyter Notebook. But I wanted a system reliable, autonomous and fast.
As a result, I built all this :
- A scheduler, watches for new post. If so, it pushes a new job to the queue.
- Redis manages the job queues, the post metadata and the embeddings
- Workers extract text from article, compute embeddings and fetch metadata from the Hacker News API
On the other hand, this whole system isn’t performant. To demonstrate, at peak, only 110 articles per second were computed while having 8 Digital Ocean droplets (2 CPU, 2 GB RAM).
I learned the hard-way how much synchronous Python code can be blocking. I’m used to writing JavaScript using async/await. With this in mind, I didn’t think about the libraryrequests blocking the script for an HTTP response. I had to spin up around 50 workers per server to have an acceptable rate.
Moreover, I might have miscalculated the size needed by Redis in RAM. At first, I thought 8 GB of RAM would be enough: I was wrong.
It should be noted that Hacker News has around 36 000 000 items (comments, stories, polls, etc.). Each job pushed to the queue is about 460 bytes. Some quick maths : 460B × 36 000 000 = 16.56 GB.
Hi swap file 👋! It was very slow. Each snapshot of the database was at least taking an hour. Next time, I will think about twice before using Redis.
Analysis
Disclaimer: The following charts contain bias and might not be representative of the real-world. Indeed, the data has only stories with a score greater than 100 and articles that are unavailable (image, some gated content, etc.) were not included.
After waiting 96 hours for my inefficient system to finish its job, I finally have exactly 108 477 articles with their embeddings.
I wanted to plot them, but vectors from Open AI have a length of 1536 and my screen is only 2D, so we have to reduce the dimension. To do so, we’re going to use the t-SNE algorithm. I don’t understand its inner workings, but as far as I know, it helps reduce a vector of dimension N to a vector of dimension 2. Which is helpful to plot it.
Scatter plot
Here is the result:
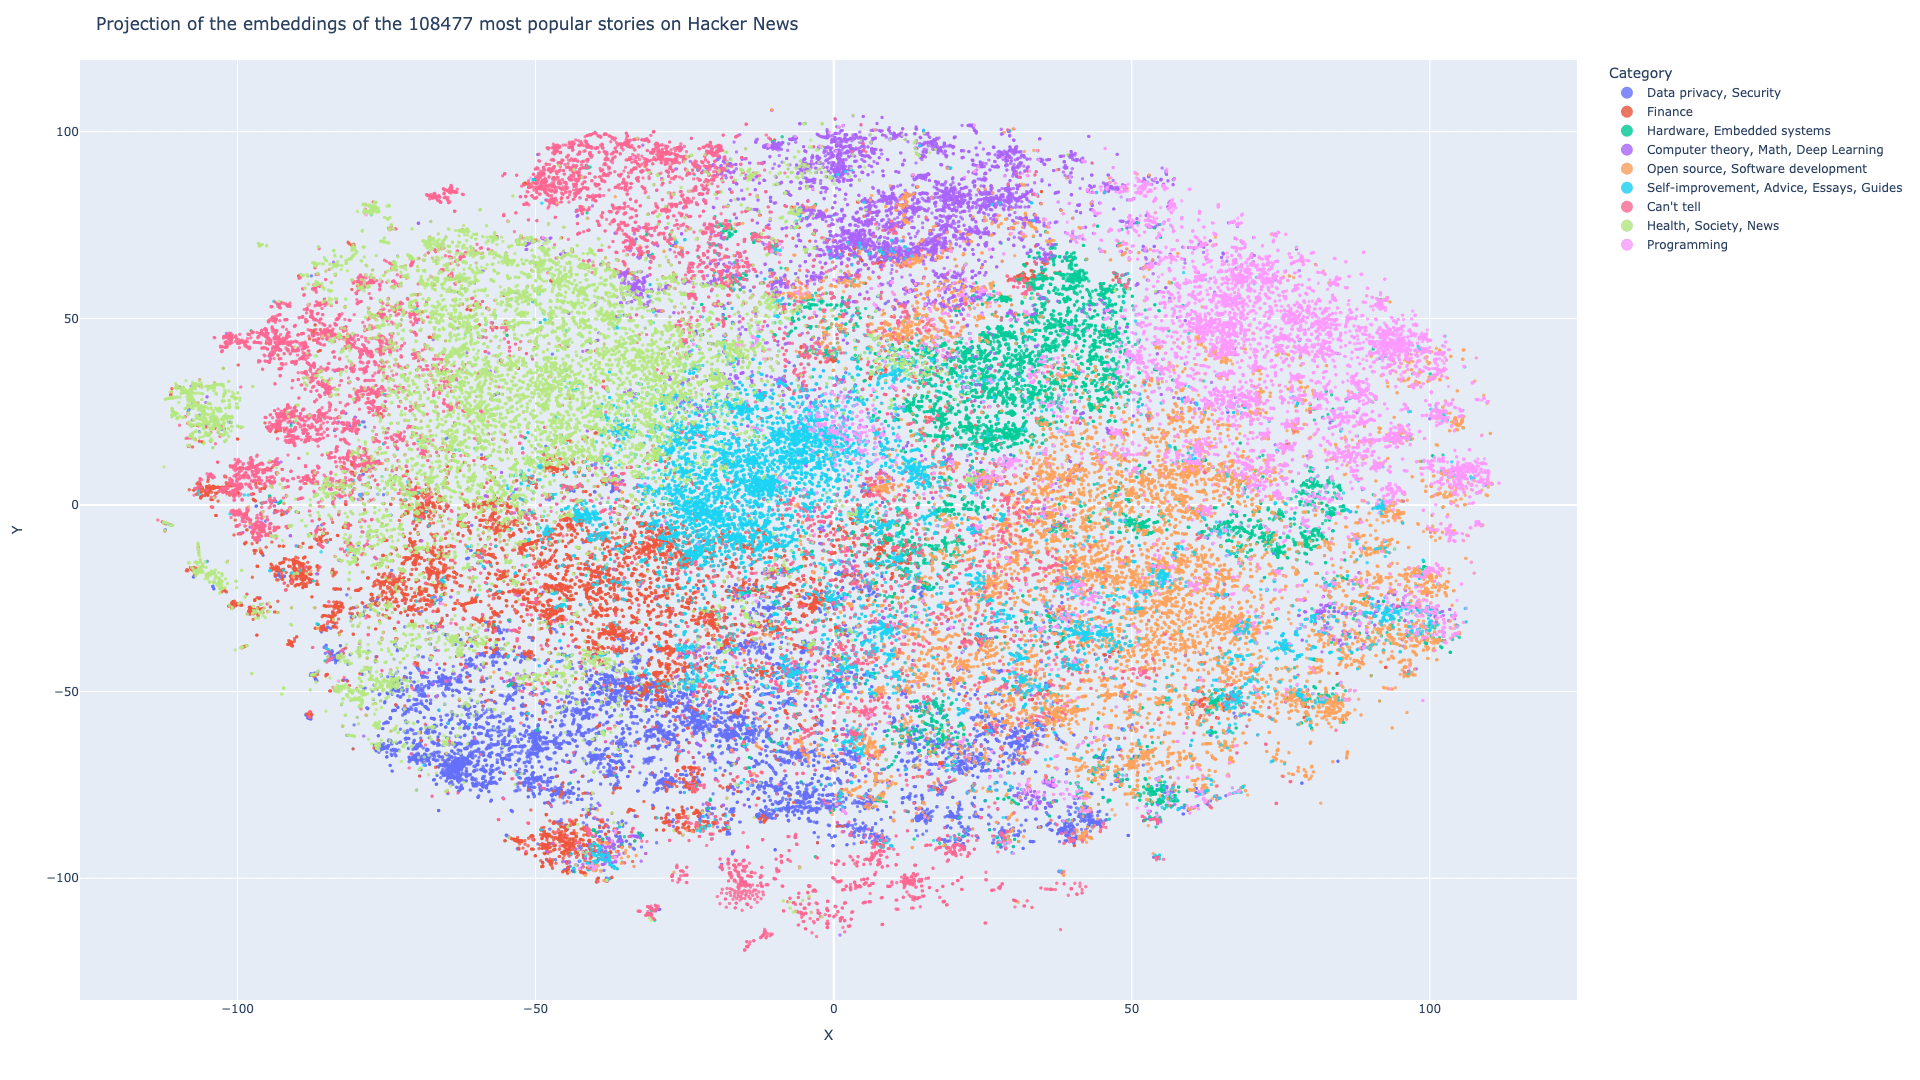
To colour the scatter plot, I have used the K-means algorithm from Scikit Learn. I made 9 clusters, labeled them one by one and plotted them using Plotly. You can find the interactive version here.
The main topics are:
- Data privacy, Security
- Finance
- Hardware, Embedded systems
- Computer theory, Math, Deep Learning
- Open source, Software development
- Self-improvement, Advice, Essays, Guides
- Can’t tell (I couldn’t figure out what those articles were about)
- Health, Society, News
- Programming
Why aren’t the colours in the same place?
Yes, it’s a good question. I used the K-means algorithm to cluster the vector in dimension 1536. Due to the t-SNE dimensionality reduction, some items may not appear in the same spot when in dimension 2.
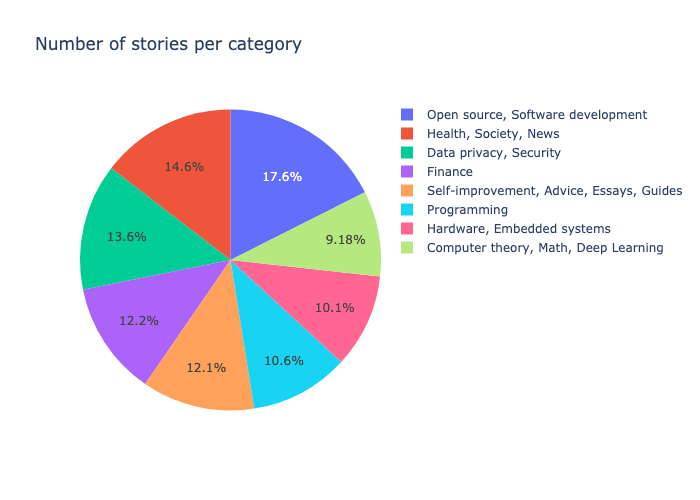
Pie chart
I’ve made a pie chart using the previously made cluster. « Open source, Software development » is by far the most popular topic in terms of number of posts.
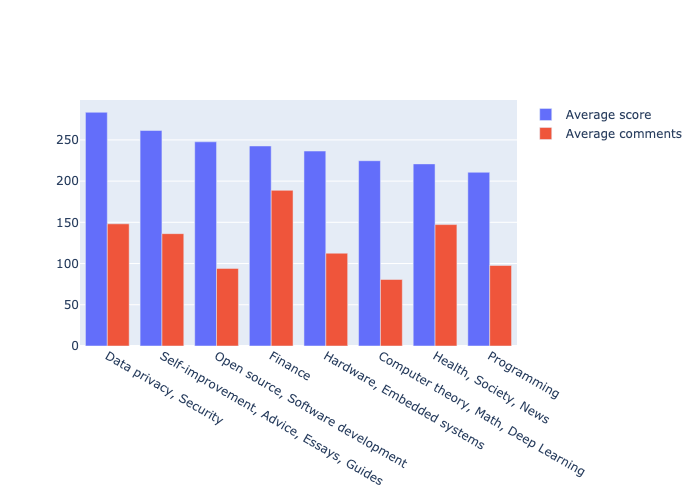
Bar chart
While in the previous chart, there were the more stories on « Open source, Software development », « Data privacy, Security » is a much more popular topics.
It’s interesting to see the difference between the number of posts vs. the popularity of the posts.
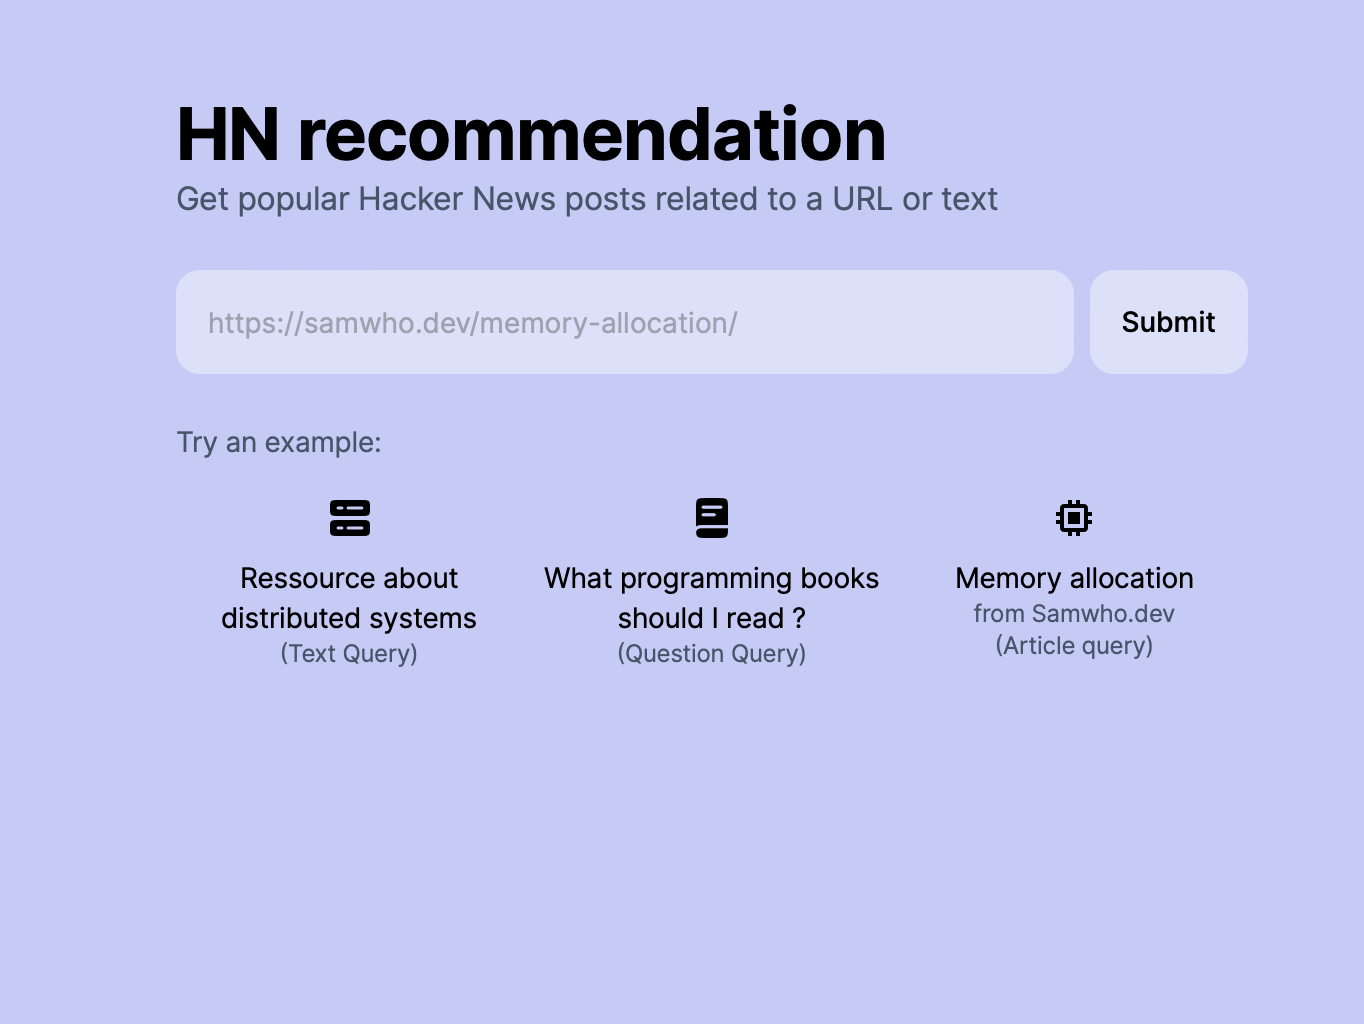
HN Recommend
To me, Hacker News looks like a goldmine of awesome articles and learning resources. But I feel like I can’t access it properly. I can’t replay sixteen years (from 2007) of posts and HN Algolia only matches words. To resolve this issue, I made HN Recommend.
Using this tool, you can get related posts to a text or a URL. I’ve personally used it to find resources about programming books or Bash.
How does it work ?
The previous work cited earlier gave me a dataset of over 100 000 embeddings. To search posts related to a query, I have to compute the embeddings of the query and get the nearest items. And for an article, it’s pretty-much the same; the only extra step is to get the text of the article from Diffbot.
Nevertheless, I can’t compute the distance with every post because it would be too inefficient (100 000 calculations per query O(n) ). To remediate, HN recommend uses Faiss and the HNSW index. Although I don’t understand the details like the t-SNE algorithm, I know it’s very efficient. On my MacBook Air M1, %%time reports 570 µs
CPU times: user 1.76 ms, sys: 1.32 ms, total: 3.08 ms
Wall time: 570 µs
Now that I have the closest items, my final job is to query the database and return the data to the user.
Dataset
I love open source. Therefore, I’m releasing the dataset for the public. You can download it from Kaggle
In addition, you can find the notebook for data visualisation here.
Thanks
I want to thank Diffbot, which allowed me to use their API for free. Without them, this project would not have been possible. I am excited to see what other projects I can create using their API in the future.